Water quality information is pretty complex and hard to digest...
That’s why we’ve designed this dashboard to explain what all the charts and spreadsheets mean. Our scientists have combed the data and created a system for understanding when its good, when it’s bad, and when it’s something in between.

We’re working to change the relationship with the water around us
We’re tracking water quality because we have a vision in which people that represent the full diversity of New York City are swimming in and around Manhattan safely, enjoying free and safe access to the river. We’re working on that vision everyday, and in the meantime, put design at the center of everything we do. Design is all around us and can be used to solve environmental problems, drive economic development, fuel innovation, teach kids, promote public health and help us understand things a little better, like this dashboard tries to do. Our project and programs recognize design’s ever-present impact on everybody.
Citizens should be given the chance to help make their cities better.
+ POOL is made up of an incredible group of people that are all working together to push for access to our rivers for swimming, and helping change our relationship with the water around us. Our friends send ideas, participate in programs, lend expertise, volunteer, support fundraising, and advocate for + POOL and the ideas generated by it.
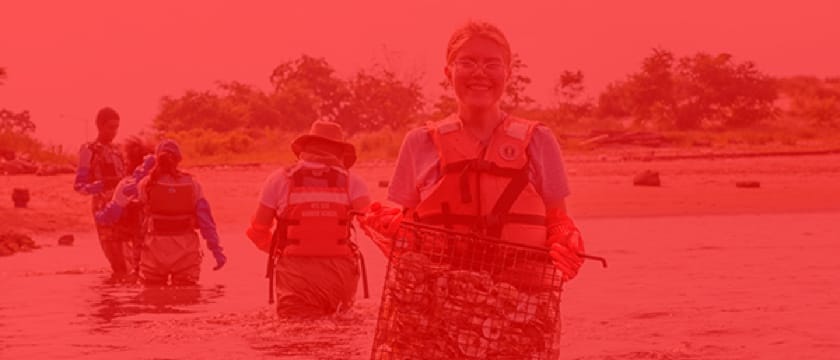
Learn about the communities that support the health of our waterways.
+ POOL isn’t at it alone. There are tons of community groups in and around NYC who care about the state of our rivers and are fighting to help protect them and keep them clean. And you can help too!
It’s time to get to know your river better.
How warm was the water today? What’s turbidity? What’s pH? How is enterococci affect our ability to swim? Dive into the dashboard and find out!
Commissioned by Friends of + POOL, Inc.
Design + Development
- Reaktor Inc
- Stephen Cronin
- Jonathan Dahan
- Anna Harrington
- Amir Kaudinov
- Ross Langley
- Savas Ozay
- Emma Smith
Data Collection
Data Analysis
- Interstate Environmental Commission
- Evelyn Powers
- Jovan Snyder
- Samantha Wilder
Advisors
- Rob Buchanan
- Dr. Wade McGillis
- Shawnee Taylor
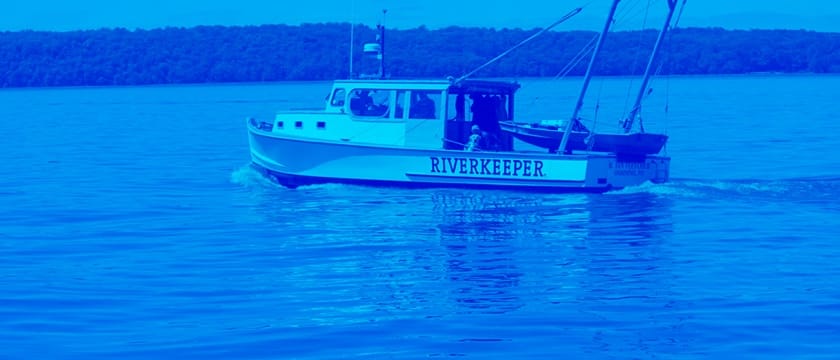
Special thanks to Billion Oyster Project for lending a boat, Arup Engineering for creating a lab, and Pier 35 for letting us sample.
This project is supported in part by an award from the National Endowment for the Arts.
